Though data-driven academics often insist that the heart of science is raw numbers, the truth is that people are influenced more by the presentation than by actual data.
By Christopher Koski
Course: Language, Gender, and Sexuality (Ling 2400)
Advisor: Prof. Kira Hall, TA Ayden Parish
LURA 2018
Such is the art of statistical analysis: Two people with two different motivations can take two identical data sets and produce facts and figures fitting two entirely different narratives. Here’s a personal favorite of mine, courtesy of Reuters. I generally consider Reuters an alright news source, but take a look at this graph:
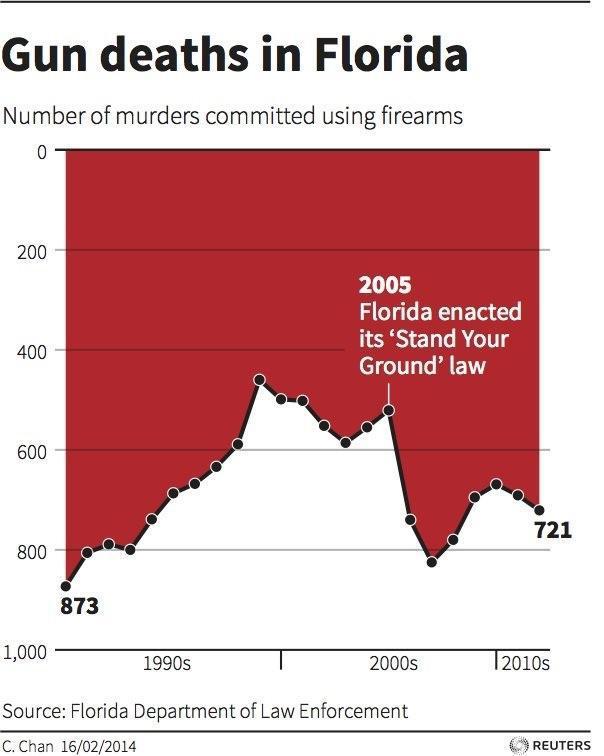
All of the data points in this graph are correct, at least according to the Florida Department of Law Enforcement. The presentation of the data, however, is misleading. This graph seems to show a slowly increasing number of gun deaths right up until 2005, where Florida’s new Stand Your Ground law coincides with a drastic decline in firearm-related fatalities. (This law basically states that you can use lethal force when you are in a situation wherein you believe you are in danger of death or serious injury.) However, the “decline” indicated in the graph is the exact opposite of what the data actually show, which is a drastic increase in the numbers of murders committed using firearms after 2005. The author, C. Chan, apparently decided to display the graph vertically mirrored, with the values on the Y-Axis increasing as you go down, rather than up. I believe that this representation was intentional.
Unfortunately, most presentation problems are less easy to spot than this example. The one I want to talk about today is a commonly cited statistic in research on language, gender, and sexuality. In fact, Penny Eckert and McConnell-Ginet, the authors of a textbook that we used in the course Language, Gender, and Sexuality (Ling 2400) at CU Boulder, also cite this statistic: babyֱ��app half of all men and half of all women are between the height of 5’ 4” and 5’ 10”. Eckert and McConnell-Ginet use this figure to question why we do not see more heterosexual relationships in which the man is shorter than the woman. Given the statistic, with half of men and women between 5’4” and 5’10”, it seems like we should see more couples where the woman is taller.
Again, the data I have available to me (sourced from the CDC) corroborates this claim. The problem is that those numbers mean a whole lot less than it looks like they do.
The problem is that the statistic itself is vague at best. Note that there isn’t actually any overlap promised by this statement: the only two things that need to be true are that half of all men are between 5’ 4” and 5’ 10” and half of all women fulfill the same condition. Let’s look at some possibilities for height values between men (blue) and women (red), based solely on the fact that half of each must be between 5’ 4” and 5’ 10”:
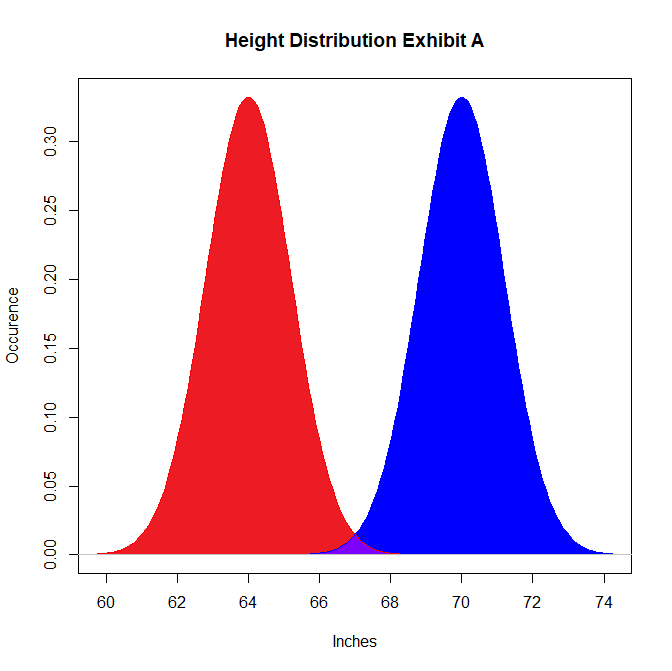
This graph is not representative of reality, but is a feasible distribution of height if our only consideration is placing half of all men and women between 5’ 4” and 5’ 10” (or 64 and 70 inches, respectively). In this graph, there is basically no overlap between heights, despite our height constraint. The odds of a relationship where the woman is taller are more or less negligible on this graph. Here’s another possibility that works within the height rule:
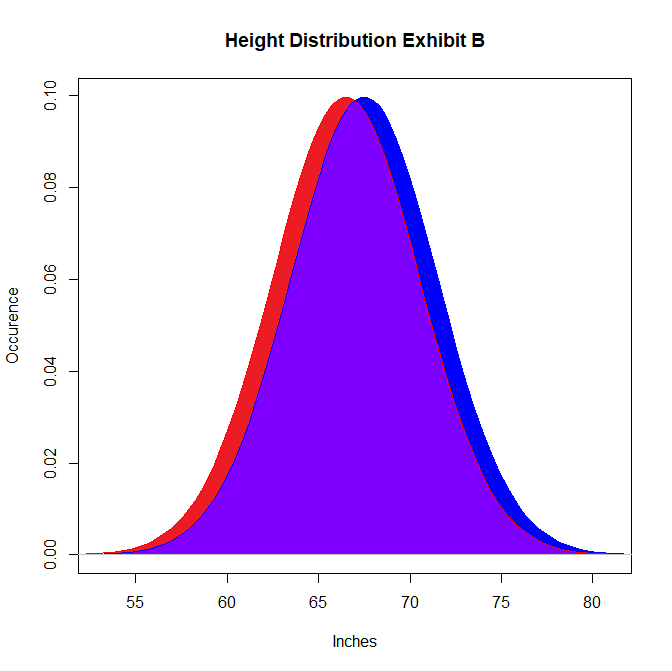
This graph also fits the height constraint, but this time the overlap includes just about everyone. If this graph was a truthful representation of height distribution, than we would expect the proportion of relationships where the woman is taller to be around 40%!
Neither of these graphs are accurate representations of height distribution, but the fact that there is so much room for error in the 5’ 4” - 5’ 10” rule means that any claims we make based off of that statistic alone are difficult to justify. Based on the CDC’s data on height distribution, here is a more accurate graph:
��
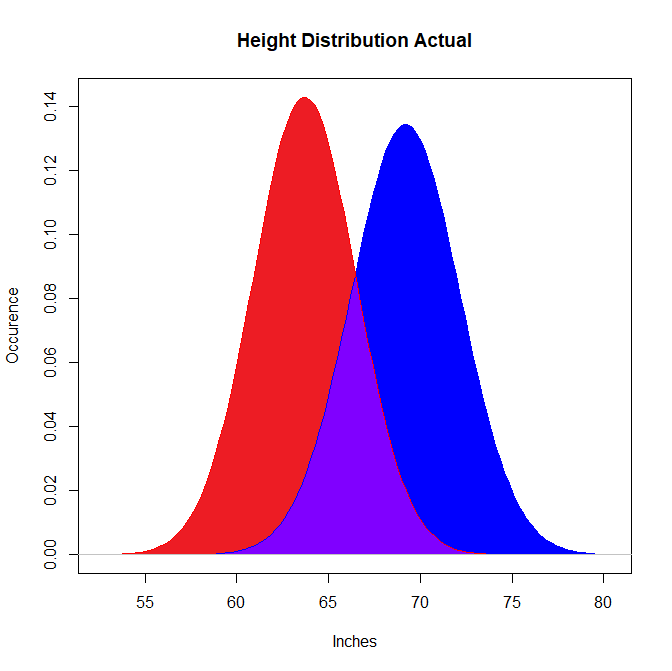
The presentation suggests that there is a good amount of overlap here, but looks can be deceiving: The actual probability of a randomly selected male-female pair having a taller woman is only around 7%, based on a simulation of 40,000 random pairings. This doesn’t even take into account that people tend to date within their demographic, and the overlap within each community is even smaller. (I’ll spare you the graphs for that, but they’re easy enough to generate from the attached dataset.)
So what’s the point of all this? I don’t actually disagree with the assertion that people select for height when dating: A study by Yancey and Emerson (2014) notes that 37% of sampled men say that they will only date women shorter than them, while 55% of sampled women say that they will only date men taller than them. I am also pretty sure that Eckert and McConnell-Ginet aren’t trying to mislead anybody with their statement; this figure has been bandied about in many gender studies over the years, so it’s most likely just a part of the lexicon now, or a part of the “hall of mirrors,” as Eckert and McConnell-Ginet would say.
I do, however, think that honesty is an important part of academia, and this includes providing people with a complete picture of the truth. When we write an academic article, textbook, or any other sort of scientific journalism, we have a duty to produce a precise, fact-based account of the claims we make. We live in an age where an enormous amount of data is generated, interpreted, and presented every day, and there are people who will use their position as statistical purveyors to mislead the masses.
When you see a strange or vague claim, try to dig a bit deeper; you may be surprised at what you find.
References
Yancey, G., & Emerson, M. O. (2014). Does Height Matter? An Examination of Height Preferences in Romantic Coupling. Journal of Family Issues, 37(1), 53-73. doi:10.1177/0192513x13519256
Anthropometric Reference Data for Children and Adults: United States, 2007–2010. (2012, October). Retrieved from
Eckert, P., & McConnell-Ginet, S. (2013). Language and gender. Cambridge, England: Cambridge University Press.
��
��
Chris Koski
 If you think Chris Koski looks like the stereotypical statistics nerd, that's probably because he is. He recently graduated from CU Boulder with a degree in Technology, Arts, and Media with a minor in Linguistics, and hopes to go back for more. In his free time, he plays a whole lot of games and music of all kinds.